Success Story
Leveraging Power BI to develop a data analytics and reporting solution for a Kenyan ICT company
Services Used:
About the client
Established in 1999, the client is a leading provider of ICT and fintech solutions in Kenya and has been instrumental in the development of communication systems, FinTech solutions & utility management applications, and platforms for government undertakings. Their implementation of prepayment systems for electricity and water meter bills helped centralize public revenue collection across rural and urban areas of Kenyan counties. The prepaid meter technology developed by them helped provide these counties with greater access to low-cost power.
- 45 high-level KPIs created
- 30% of manual analysis eliminated with automated reporting
- 66% reduction in data processing efforts
Business Situation
The client wanted to develop a data enrichment and reporting system to carry out the processing and manipulation of data for the Kenyan government. The data was based on various avenues of revenue generation, such as permits for opening business units and driving public service vehicles, parking passes, and government cess.
Daffodil Software turned out to be their best option as a technology partner, owing to its wealth of data engineering know-how and experience in developing comprehensive data analytics solutions for public-sector operators.
The client’s requirements were gathered promptly, which were the following:
- Develop forecasting for revenue and agent performance using staged data in lieu of historical data
- Design ergonomic websites for payments, agent management, and workflows
- County, sub-county, ward-zone and time-based filters must be available for a drill-down view of the revenue data
- Implement as many different Key Performance Indicators (KPI) as possible across all pages of the aggregated data representations
- Restrict access to only a handful of authorised entities but with minimal operational overhead
The Solution
Leveraging Power BI, the data was cleansed and regularized and an option to expand the dataset was also provided in case of potential scaling. Data enrichment has helped create the following reports and dashboards:
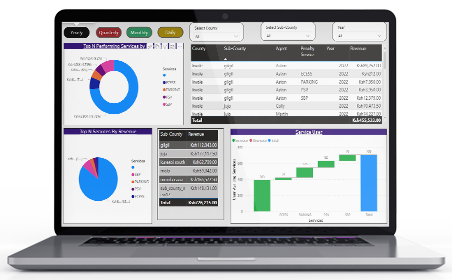
- Comparative analysis based on timestamps for monthly, daily, and quarterly data
- Cohort analysis for revenue collected from Single Business Permit (SBP), E-Cess, Parking Pass, and Public Service Vehicles (PSV) passes
- Report generation from revenue dashboards for penalty services as well as daily or long-term permits
- Consistent monitoring to ascertain top-performing revenue services, top-performing agents, and top-performing Kenyan counties, sub-counties, wards, and zones

All the other data processing capabilities and enhancements to the system are detailed below:
Calibration for Gaps in Data
The biggest challenge that was overcome by the team was the unavailability of historical data to build conceptual and logical models. Since forecasting cannot be done without historical data, the team developed a workaround strategy. Using Power BI, various conservative and aggressive scenarios were developed, compared, and contrasted to produce the most appropriate data models for the current data. Continuous testing of the database was carried out to check for data mismatches and mistakes in the various layers of the workflow.
Roll Down Authorizations
Access to various data groups was given on the basis of roll-down authorizations. Authorization was determined by an entity’s ranking in the hierarchical order of operations. Full access was made available only to governors, deputy governors, and high-level executives from the finance ministry. Certain specific users now have access to view county-specific data, while a super admin decides the drill-down levels of access only to emails of the authorized domain.

Scheduled Automation
A well-crafted data flow was implemented for migrating the FinTech provider’s database to the Power BI database. Particular intervals of the Kenyan standard time would trigger the refreshing of each report formulated from the above-mentioned database connection. The standard interval for report generation and updation was set at a 2.5 hours frequency. Based on the filters set by the end-user, the reports generated can be data contextual, taking dynamic data inputs for customized reports.
Service and Revenue Forecasting
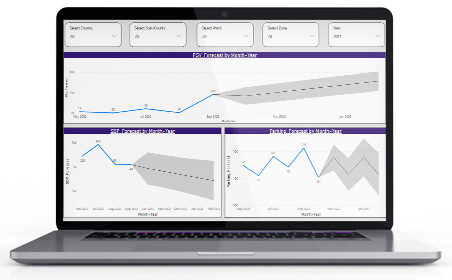
The data enrichment team applied upper-bound and lower-bound possibilities to increase the accuracy of service and revenue forecasts. By taking the uncertainty range into consideration the team minimized the processing time and the number of processes involved in forecasting to help with faster parameter searching across the forecasts. Goals and estimates can also be set for exploring more avenues for revenue generation.

High-Level KPIs
Around 45 high-level KPIs were implemented across 10-11 pages of each type of data representation or report. Based on certain feedback from the service provider, different co-related KPIs were clubbed together where needed. This allows a view of the top-performing revenue streams enabling the respective higher-ups to formulate better revenue generation strategies. The system can zero in on agents generating the most revenue and present data for the ward or county they are allocated to.

The Impact
Due to the data enrichment carried out by the Daffodil team, the Kenyan services provider was enabled with high-fidelity reporting capabilities for their revenue data. Higher-ups in the Kenyan government were able to formulate better strategies going off of the data insights gathered so that hundreds of villages and wards were able to become recipients of low-cost power and water lines much faster than before. The next version of the data processing system developed by the team will have embeddings that have service-specific filters as well as data around customer demographics for greater insights.
Read Related Case Studies
Get in Touch
Sign up for a 30 min no-obligation strategic session with us
Let us understand your business objectives, set up initial milestones, and plan your software project.
At the end of this 30 min session, walk out with:
- Validation of your project idea/ scope of your project
- Actionable insights on which technology would suit your requirements
- Industry specific best practices that can be applied to your project
- Implementation and engagement plan of action
- Ballpark estimate and time-frame for development


